Sources: nscb.gov.ph, nwpc.dole.gov
In the last few years, labor, employment and wages have gone through significant shifts.
Labor and Employment
Infographic by Jan-Daniel S. Belmonte
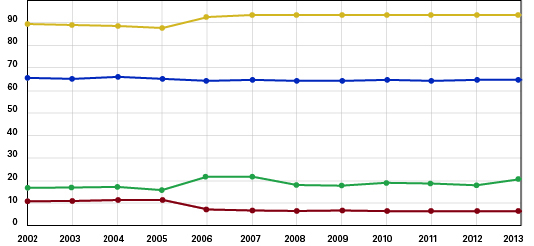
Household Population 15 Years Old and Over by Employment Status
January 2002 – January 2013
|
Period |
Labor Force Participation Rate |
Employment Rate (in %) |
Unemployment Rate (in %) |
Underemployment Rate (In %) |
| Jan 2013 | 64.1 | 92.9 | 7.1 | 20.9 |
| Jan 2012 | 64.3 | 92.8 | 7.2 | 18.8 |
| Jan 2011 | 63.7 | 92.6 | 7.4 | 19.4 |
| Jan 2010 | 64.5 | 92.7 | 7.3 | 19.7 |
| Jan 2009 | 63.3 | 92.3 | 7.7 | 18.2 |
| Jan 2008 | 63.4 | 92.6 | 7.4 | 18.9 |
| Jan 2007 | 64.8 | 92.2 | 7.8 | 21.5 |
| Jan 2006 | 63.8 | 91.9 | 8.1 | 21.3 |
| Jan 2005 | 66.1 | 88.7 | 11.3 | 16.1 |
| Jan 2004 | 67.3 | 89.0 | 11.0 | 17.5 |
| Jan 2003 | 65.7 | 89.4 | 10.6 | 16.1 |
| Jan 2002 | 66.4 | 89.7 | 10.3 | 15.9 |
Statistics show that although the Labor Force Participation Rate, the Employment Rate and the Unemployment Rate are on the right track. However, the Underemployment Rate continues to be problematic. This means that the number of people employed have increased but are not necessarily in the field they were trained for.
Employed Persons by Major Industry Group (in thousands)
January 2008 – January 2011
|
Industry Group |
Jan 2011 |
Jan 2010 |
Jan 2009 |
Jan 2008 |
| Total | 36,290 | 36,001 | 34, 262 | 33,693 |
| Agriculture | 11,952 | 11,806 | 11,846 | 11,792 |
| Industry | 5,264 | 5,322 | 4,856 | 4,981 |
| Services | 19,074 | 18,872 | 17,560 | 16,919 |
Statistics show that 2011 is the year the number of employed persons is highest. In addition, most of these people fall under the service industry group. It can also be seen that the number of people in the service industry has increased the most. This may be attributed to the increase of business process outsourcing in the past few years.
Deployed Land-Based Overseas Filipino Workers by Major World Groupings
2000 – 2010
| Year | 2010 | 2009 | 2008 | 2007 | 2006 | 2005 | 2004 | 2003 | 2002 | 2001 | 2000 |
| Total 1/ |
1,123,676 |
1,092,162 |
974,399 |
811,070 |
788,070 |
740,632 |
704,586 |
651,938 |
682,315 |
662,648 |
643,304 |
| Africa |
25,207 |
18,967 |
16,434 |
13,126 |
9,450 |
9,103 |
8,485 |
8,750 |
6,919 |
4,943 |
4,298 |
| Asia |
280,808 |
260,995 |
219,598 |
218,983 |
222,940 |
255,084 |
266,609 |
254,520 |
288,481 |
285,051 |
292,067 |
| Europe |
48,185 |
47,409 |
51,795 |
45,613 |
59,313 |
52,146 |
55,116 |
37,981 |
45,363 |
43,019 |
39,296 |
| Middle East |
684,060 |
669,042 |
631,828 |
487,878 |
462,545 |
394,419 |
352,314 |
285,564 |
306,939 |
297,533 |
283,291 |
| Oceania |
12,341 |
13,297 |
15,030 |
10,691 |
5,126 |
2,866 |
3,023 |
1,698 |
1,917 |
2,061 |
2,386 |
| The Americas |
25,696 |
31,146 |
31,916 |
28,019 |
21,976 |
14,886 |
11,692 |
11,049 |
11,532 |
10,679 |
7,624 |
| Trust Territories |
3,107 |
5,134 |
5,461 |
6,674 |
6,481 |
7,596 |
7,177 |
5,023 |
6,075 |
6,823 |
7,421 |
| Unspecified |
44,272 |
46,172 |
2,337 |
86 |
– |
135 |
1 |
46,279 |
10,882 |
11,530 |
6,921 |
Minimum Wage
Summary of Wage Legislations Granting Increases in the Basic Minimum Wage
1951 – 2013
| Effective Date | Order/Act/Decree | Minimum Wage in NCR |
| 4 Aug 1951 | Minimum Wage Law (R.A. 602) | P4.00 |
| 8 Aug 1963 | Agricultural Land Reform Code (R.A. 3844) | – |
| 21 Apr 1965 | Minimum Wage Law Amendment (R.A. 4180) | 6.00 |
| 18 Jun 1966 | Minimum Wage Law Amendment (R.A. 4707) | 6.00 |
| 17 Jun 1970 | Minimum Wage Law Amendment (R.A. 6129) | 8.00 |
| 1 Jun 1976 | Presidential Decree 928 | 10.00 |
| 1 Jul 1978 | Presidential Decree 1389 | 11.00 |
| 1 Apr 1979 | Presidential Decree 1614 | 13.00 |
| 18 Aug 1980 | Presidential Decree 1713 | 14.00 |
| 1 Jan 1981 | Presidential Decree 1753 | 18.00 |
| 6 Jul 1983 | Wage Order No. 2 | 19.00 |
| 1 Nov 1983 | Wage Order No. 3 | 20.00 |
| 1 Dec 1983 | Wage Order No. 3 | 21.00 |
| 1 May 1984 | Wage Order No. 4 | 32.00 |
| 16 Jun 1984 | Wage Order No. 5 | 35.00 |
| 1 Nov 1984 | Wage Order No. 6 | 37.00 |
| 1 May 1987 | Executive Order No. 178 | 46.00 |
| 1 Oct 1987 | Executive Order No. 178 | 54.00 |
| 14 Dec 1987 | Republic Act No. 6640 | 64.00 |
| 1 Jan 1988 | Executive Order No. 178 | 54.00 |
| 1 Jul 1989 | Republic Act No. 6727 | 89.00 |
| Nov. 1, 1990 | WO 01 | 106.00 |
| Jan. 8, 1991 | WO 02 | 118.00 |
| Dec. 16, 1993 | WO 03 | 135.00 |
| April 1, 1994 | 145.00 | |
| Feb. 2, 1996 | WO 04 | 161.00 |
| May 1, 1996 | 165.00 | |
| Feb. 6, 1997 | WO 05 | 180.00 |
| May 1, 1997 | 185.00 | |
| Feb. 6, 1998 | WO 06 | 198.00 |
| Oct. 31, 1999 | WO 07 | 198.00-223.50 |
| Nov. 1, 2000 | WO 08 | 213.00-250.00 |
| Nov. 5, 2001 | WO 09 | 228.00-265.00 |
| Feb. 1, 2002 | 243.00-280.00 | |
| July 10, 2004 | WO 10 | 263.00-300.00 |
| June 16, 2005 | WO 11 | 288.00-325.00 |
| July 11, 2006 | WO 12 | 313.00-350.00 |
| August 28, 2007 | WO 13 | 325.00-362.00 |
| June 14, 2008 | WO 14 | 345.00-382.00 |
| August 28, 2008 | 345.00-382.00 | |
| July 1 , 2010 | WO 15 | 367.00-404.00 |
| May 26 , 2011 | WO 16 | 389.00-426.00 |
| June 3, 2012 | WO 17 | 409.00-446.00 |
| Nov. 1, 2012 | 419.00-456.00 | |
| Oct. 4, 2013 | WO 18 | 429.00-466.00 |
| Jan.1, 2014 | 429.00-466.00 |