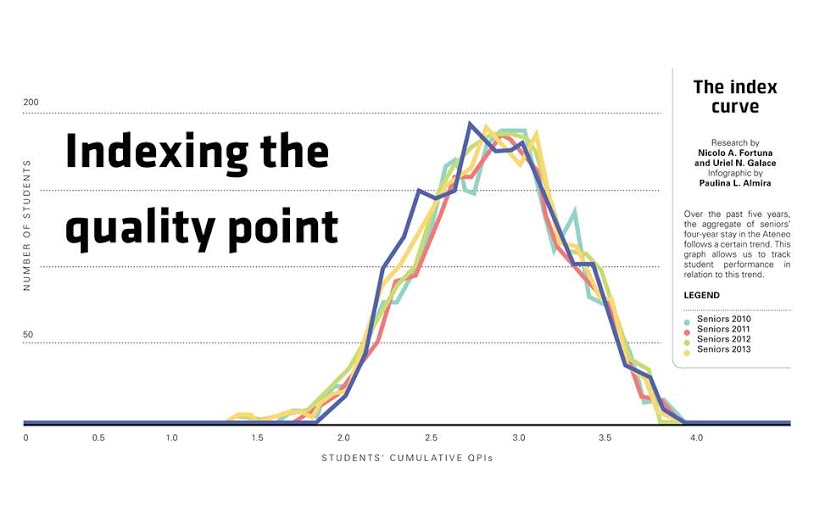
Imagine a graph: A bell curve skewed to the left with empty space on one side of it, suggesting a lack of frequency per data value in that area. The placement of the graph—a right-leaning slant—illustrates a disproportionate distribution of values. A flat line climbs to a peak. The peak, then, slopes downward to a stop.
This is the bell curve of the cumulative quality point indices (QPIs) for school year (SY) 2013 to 2014. The peak shows how many students had cumulative QPIs in the 2.5 to 3.5 (C+ to B+) range. Last SY, this accounted for 71.9% of the student population, up 5% from a decade ago.
This finding is hardly new. In actuality, this statistical trend in the grade distribution was already pointed out to the school administration almost a decade ago.
Polarizing essay
In 2006, the late Manuel Tejido, PhD, a former faculty member of the Department of Theology, wrote an essay for the Loyola Schools Review on grades entitled “Giving the Grade: Teachers’ Assessment of Students.” Tejido, among other things, evaluated the school’s grade distribution—the number of As, B+s, Bs and so on being given for each subject. The results of his study showed that grades were slightly higher than what would normally be expected given the university’s grading system.
“B+, B and C+ grades were 66.8% of the total grades for the first semester of SY 2004 to 2005 and 67.9% of the total grades of the second semester for this same school year,” he wrote. “These show that grades are somewhat tilted towards these higher marks and some degree of the so-called ‘grade inflation’ seems noticeable in the Loyola Schools.”
Tejido had two things in mind when he referred to grade inflation. First, by grade inflation, he meant having “too many high final marks” in the given SY. Second, he also referred to a “disproportionate number of A’s, B+’s, and B’s” over “C’s, D’s, and F’s.” This is different from the practice of professors’ artificially raising their students’ grades—curving, as it is colloquially known. However, he did mention that curving may be one of its potential causes.
Trends such as this are of the utmost importance, if only because they serve to shed light on the school’s grading system, which is central to a student’s academic life. Unfortunately, little is known by the student body about the variation in grades in the LS, as this data is not readily accessible to the general public.
As such, The GUIDON procured data from the Office of the Registrar on the cumulative and yearly QPIs of all students in the LS from SY 2009 to 2010 to the most recent SY.
The data reveals a number of interesting findings.
Grades rising
One trend that may be seen in the data is that, over the past five years, freshmen have averaged a yearly QPI of about 2.74, while seniors have averaged about 3.04. This shows that, overall, seniors tend to have higher QPIs than freshmen. The figures are even more striking when one looks at the individual tallies. Last SY alone, a mere 10 seniors had a QPI between 2.0 and 2.1, compared with almost six times as many freshmen. In the same year, 113 seniors had a QPI of 3.5, whereas 49 freshmen—less than half as many as the seniors—met that threshold.
This increase in grades happens consistently from one year level to the next. Grades are lowest in freshman year, jump considerably come sophomore year, continue to rise slightly in junior year before soaring again in senior year. It is only by senior year that many students manage to attain a QPI of 3.0 or above.
On the surface, these findings may seem counterintuitive. “QPIs may decline from third year to fourth year because these are the times when students mostly take their harder [or] higher-level major [or] subject specific courses,” says Miguel Vilchez, a staff member of the Office of the Associate Dean for Academic Affairs (ADAA).
Marvin Cruz, a counselor from the Office of Guidance and Counseling (OGC), attributes the unexpected rise in grades to an increase in students’ motivation. “The [higher their year level], the more they become serious with what they’re doing,” he says. According to him, a top concern among graduating students is employability, so the tendency for students is to start worrying about their Transcript of Records, one of the documents they submit when they apply for a job.
He also points to an “adjustment period” among freshmen as a potential reason why grades tend to bottom out in first year. “[This is] because they’re new–[they come] from high school [and are] going to college. And as we know, Ateneo is relatively strict when it comes to compliance with grade requirements,” he says.
Grade inflation: Fact or fiction?
Another noteworthy trend is that majority of the grades are distributed along the C+ to B+ range. For the past five years, 30,349 cumulative QPIs out of 40,762 from the data set—or 74.5%of the student population—had QPIs between 2.5 and 3.5.
Tejido opined that the unusually large number of high marks being given by professors could provide evidence for grade inflation. “The allegation that there is some ‘grade inflation’ can be substantiated by the data available. The grade distribution in both semesters is clearly tilted towards the higher marks,” was his unequivocal conclusion.
Tejido worried that this phenomenon could compromise the academic standards in the university, lamenting that low academic expectations could give the Ateneo a bad name. He also deplored the notion that some professors could intentionally be giving higher grades as a way of gaining popularity. “Some end up giving so many ‘A’ marks not because students deserve them but because, God forbid, they want to attract more students in their classes in the next semester,” he wrote.
Nevertheless, he stressed that grade inflation does not necessarily have to be viewed in such a negative light. His article sought to divert attention from the issue by asserting that having good teachers should naturally lead to higher grades. Additionally, their using grade metrics that are able to accurately assess student performance based on tangible outcomes would also make for higher grades.
In doing so, he acknowledged that high grades in the school “could also be seen as a sign of effective teaching and learning,” even celebrating the prospect of a large number of students entering the Dean’s List. “In the Loyola Schools of the Ateneo de Manila University, most of our college students are very sensitive and highly intelligent. They come from the best high schools and have passed through the Ateneo College Entrance Test before admission to first year,” he wrote. “Why should good teachers hesitate to give them the high marks they deserve?”
A decline
[blockquote author=”Manuel Tejido +, Faculty member, Theology Department” pull=”pullright”]Why should good teachers hesitate to give them the high marks they deserve?[/blockquote]
Cumulative QPIs in the Ateneo have been slowly, but surely, declining overall for the past five years. For the total average of cumulative QPIs that were obtained, the value decreases by about 0.01 a year; from around 2.86 in SY 2009 to 2010 to around 2.81 in the most recent SY. The data for yearly QPIs does not decrease as cleanly, but it still ultimately points at a consistent downtrend–at least for the past five years.
An increase in the number of withdrawals from classes due to academic reasons aggravates this downward trend. According to data obtained from the ADAA, the number of students who withdraw from their classes has steadily risen over the past five years. Although the change has been minute—184 students in the second semester of last SY, 170 in the second semester of SY 2009 to 2010—the rise has been fairly steady.
The fact that cumulative QPIs have declined over the past five years could very well be a cause for concern. This may raise the possibility that the university has become more stringent in its grading system or perhaps that it has failed to attract a more talented group of high school students, as compared with previous years. It may also point to a decline in the study habits and overall commitment of students to their education, a theme echoed anecdotally by many older professors.
Vilchez cautions, however, that this is all just speculation and that nothing definitive can be known until further study has been conducted on the matter. “There are many factors that might have contributed to this downward trend… However, in order to list these factors it might be better to conduct quick interviews or survey with students asking them that question,” he says.
Grade-conscious
This downward trend in grades may only serve to amplify many students’ fears. According to a school-wide survey conducted by the OGC, “doubts about being unable to meet an expected QPI,” “feelings of being inadequately prepared for meeting my teacher’s/department’s standards” and “unrealistic academic expectations” ranked second, fourth and seventh out of 25, respectively, among the students’ top concerns. Students’ anxieties, then, may factor into the consistent overall decrease in their grades for the past five years.
In an effort to improve learning outcomes, the administration has put in place multiple systems to improve the quality of education. The installation of Wi-Fi around campus, access to the state-of-the-art New Rizal Library and modernized teaching methods (such as the inclusion of audio-visual presentations in class lectures) are only some of many recent efforts the university has made to augment students’ learning.
In addition, a rise in the number of scholars, stronger basic education programs and better study tools (for instance, the inclusion of built-in dictionaries in students’ cellphones and laptops) are also some of the factors that, theoretically, should improve the student body’s overall academic performance.
These improvements may have been contributing to how individual students’ grades rise as they go up the year levels and how most grades are in the C+ to B+ range.
Unfortunately, the records that were studied here only present data from the past five SYs—the time when records started to become fully automated. It cannot be known, then, whether these statistical trends are recent phenomena or whether they have been happening for a long time.
Only one thing is sure—that it is worth further investigation.
UPDATED: July 13, 2014, 4:27 PM